Candlestick Charting
Candlestick Charting: A Beginner's Guide
Welcome to the world of cryptocurrency trading
What are Candlestick Charts?
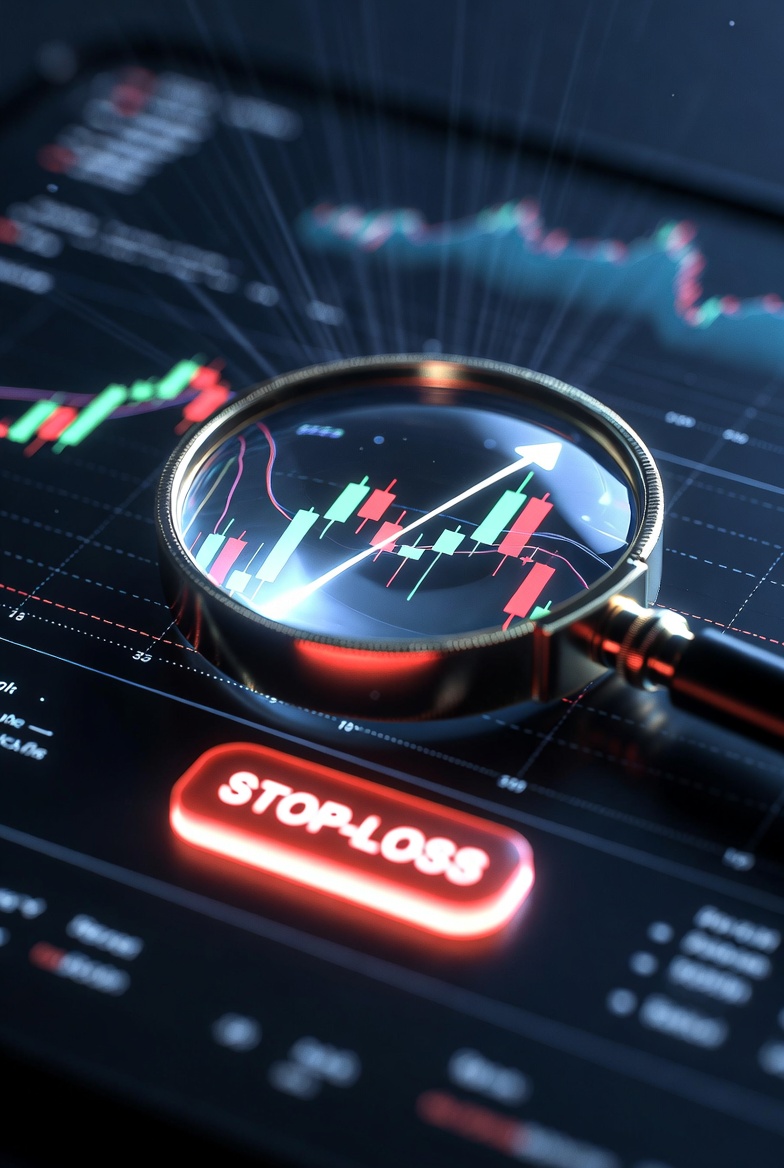
Candlestick charts are a visual way to represent price movements of an asset – like Bitcoin or Ethereum – over a specific period. They show the opening price, closing price, highest price, and lowest price for that period. Think of them as a snapshot of the price action. They originated in Japan for rice trading, but have become a standard in financial markets globally.
Unlike a simple line chart which just connects closing prices, candlesticks provide much more information at a glance. They're easier to interpret than other chart types, allowing you to quickly identify potential trading signals. You can access these charts on most cryptocurrency exchanges like Register now Binance, Start trading Bybit, Join BingX, Open account Bybit, and BitMEX.
Understanding the Anatomy of a Candlestick
Each candlestick represents a single time period (e.g., 1 minute, 1 hour, 1 day). It has two main parts:
- **The Body:** The rectangular part of the candlestick. It represents the range between the opening and closing prices.
- **The Wicks (or Shadows):** The thin lines extending above and below the body. They show the highest and lowest prices reached during that period.
- **Green (or White) Candlestick:** Indicates that the closing price was *higher* than the opening price. This means the price went *up* during that period. This is a *bullish* candle.
- **Red (or Black) Candlestick:** Indicates that the closing price was *lower* than the opening price. This means the price went *down* during that period. This is a *bearish* candle.
- Opening Price: $65,000
- Closing Price: $66,000
- Highest Price: $66,500
- Lowest Price: $64,800
- **Doji:** A candlestick with a very small body, indicating that the opening and closing prices were nearly the same. It signals indecision in the market.
- **Hammer:** A candlestick with a small body at the top and a long lower wick. It often appears at the bottom of a downtrend and can signal a potential reversal.
- **Hanging Man:** Looks exactly like a hammer, but appears at the *top* of an uptrend, suggesting a possible reversal.
- **Engulfing Pattern:** A two-candlestick pattern where the second candlestick's body completely "engulfs" the body of the first candlestick. A bullish engulfing pattern (green engulfing red) suggests a potential uptrend, while a bearish engulfing pattern (red engulfing green) suggests a potential downtrend.
- **Morning Star & Evening Star:** These are three-candlestick patterns that signal potential trend reversals. A Morning Star appears in a downtrend and signals a potential uptrend. An Evening Star appears in an uptrend and signals a potential downtrend.
- **1-minute, 5-minute, 15-minute:** Used for *scalping* – very short-term trading.
- **1-hour, 4-hour:** Used for *day trading* and swing trading.
- **Daily, Weekly, Monthly:** Used for *long-term investing* and identifying overall trends.
- **Moving Averages:** Help smooth out price data and identify trends. Learn about moving average convergence divergence (MACD).
- **Relative Strength Index (RSI):** Measures the magnitude of recent price changes to evaluate overbought or oversold conditions.
- **Volume:** Shows the amount of trading activity. High volume confirms the strength of a trend. Understanding volume weighted average price (VWAP) is key.
- **Fibonacci Retracements:** Identify potential support and resistance levels.
- Trading Strategies
- Technical Analysis
- Risk Management
- Order Types
- Support and Resistance
- Bollinger Bands
- Chart Patterns
- Trend Lines
- Market Capitalization
- Fundamental Analysis
- Register on Binance (Recommended for beginners)
- Try Bybit (For futures trading)
Here's how to interpret the color (or pattern) of the body:
Let's illustrate with an example:
If a Bitcoin candlestick for a 1-hour period shows:
This would be a green candlestick. The body would stretch from $65,000 to $66,000, and there would be a wick extending upwards to $66,500 and downwards to $64,800.
Key Candlestick Patterns
While individual candlesticks are helpful, patterns formed by multiple candlesticks can provide stronger signals. Here are a few common ones:
| Pattern | Description | Potential Signal |
|---|---|---|
| Doji | Small body, long wicks. Opening and closing prices are similar. | Indecision, potential trend reversal. |
| Hammer | Small body at the top, long lower wick. | Bullish reversal at the bottom of a downtrend. |
| Engulfing (Bullish) | Green candle engulfs a previous red candle. | Potential uptrend. |
Timeframes & Choosing the Right One
Candlestick charts can be displayed in various timeframes:
The best timeframe depends on your trading style and goals. Beginners often start with the 1-hour or 4-hour charts to get a feel for price action. It's important to understand timeframe analysis.
Combining Candlesticks with Other Indicators
Candlestick patterns are most effective when used in conjunction with other technical indicators like:
Using these tools together can help you make more informed trading decisions.
Practical Steps to Start Using Candlestick Charts
1. **Choose an Exchange:** Select a reputable cryptocurrency exchange like Register now Binance. 2. **Select a Trading Pair:** For example, BTC/USD (Bitcoin against the US dollar). 3. **Choose a Timeframe:** Start with 1-hour or 4-hour charts. 4. **Practice Identifying Candlesticks:** Learn to recognize bullish and bearish candles, Dojis, Hammers, etc. 5. **Look for Patterns:** Start spotting common candlestick patterns. 6. **Combine with Indicators:** Add moving averages or RSI to your chart to confirm signals. 7. **Paper Trade:** Before risking real money, practice with a demo account or paper trading to test your strategies.
Resources for Further Learning
Remember that trading involves risk. Always do your own research and never invest more than you can afford to lose. This is just a starting point – continuous learning is essential for success in the world of cryptocurrency trading.
Recommended Crypto Exchanges
| Exchange | Features | Sign Up |
|---|---|---|
| Binance | Largest exchange, 500+ coins | Sign Up - Register Now - CashBack 10% SPOT and Futures |
| BingX Futures | Copy trading | Join BingX - A lot of bonuses for registration on this exchange |
Start Trading Now
Learn More
Join our Telegram community: @Crypto_futurestrading⚠️ *Disclaimer: Cryptocurrency trading involves risk. Only invest what you can afford to lose.* ⚠️